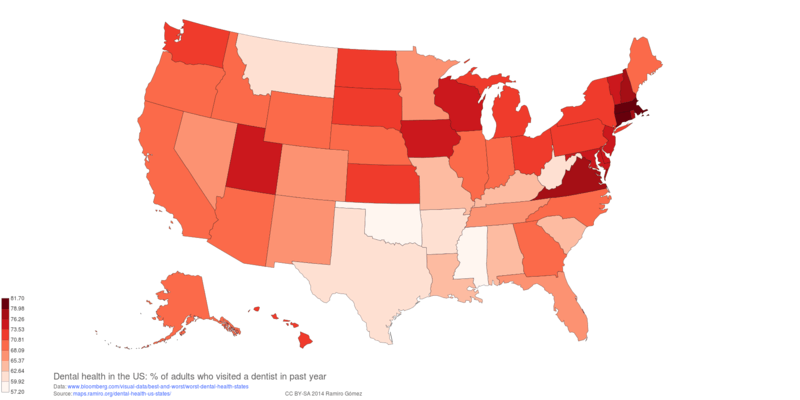
Dental Health US
Notebook to retrieve and cleanup statistics on dental health in the US published by Bloomberg.
In [1]:
import pandas as pd
import matplotlib.pyplot as plt
import geonamescache

from lxml import html

gc = geonamescache.GeonamesCache()

url ='http://www.bloomberg.com/visual-data/best-and-worst/worst-dental-health-states'
xpath = '//*[@class="hid"]'

tree = html.parse(url)
table = tree.xpath(xpath)[0]
raw_html = html.tostring(table)

df = pd.read_html(raw_html, header=0, parse_dates=[1])[0]
df.head()
Out[1]:
Cleanup columns by removing unnecessary characters and convert percentage value into float.
In [2]:
def fl(x):
    return float(x.rstrip('%'))

df['State'] = df['State'].apply(lambda x: x.rstrip('t').strip())
df['Dental health score'] = df['Dental health score  i']
df['% of population living in a dental HPSA'] = df['Percentage of population living in a dental HPSA  i'].apply(fl)
df['% of adults who visited a dentist in past year'] = df['Percentage of adults who visited a dentist in past year'].apply(fl)
df['% of seniors with no natural teeth'] = df['Percentage of seniors with no natural teeth  i'].apply(fl)
df.head()
Out[2]:
Map state names to FIPS codes and delete columns not needed in the Web based map.
In [3]:
states = gc.get_dataset_by_key(gc.get_us_states(), 'name')
df['fips'] = df['State'].apply(lambda x: 'US' + states[x]['fips'])

del df['Rank'], df['State'], df['Dental health score  i'], df['Percentage of population living in a dental HPSA  i']
del df['Percentage of adults who visited a dentist in past year'], df['Percentage of seniors with no natural teeth  i']
df.head(5)
Out[3]:
Save as CSV.
In [4]:
df.to_csv('../static/data/csv/dental-health-us-states.csv', encoding='utf-8', index=False)
Volcano Map Poster
Recommended Books

IPython Interactive Computing and Visualization Cookbook

Python for Data Analysis: Data Wrangling with Pandas, NumPy, and IPython

Python Data Visualization Cookbook
Links to Amazon and Zazzle are associate links, for more info see the disclosure.

About this post
This post was written by Ramiro Gómez (@yaph) and published on August 07, 2014.
blog comments powered by Disqus