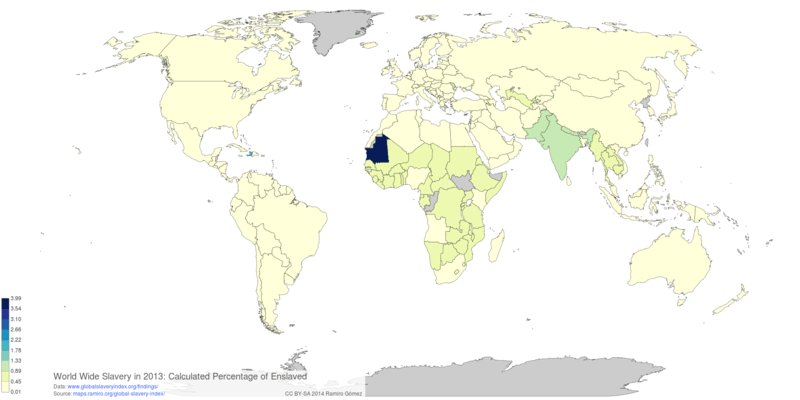
Global Slavery Index Ranking
This notebook shows how to retrieve the country rankings from the Global Slavery Index and save it as a CSV file.
First import the required libraries.
from lxml import html
import pandas as pd
import geonamescache

gc = geonamescache.GeonamesCache()
Find the 5th HTML table on the page and convert it into a Pandas data frame. Print the 1st few rows to inspect the data.
url ='http://www.globalslaveryindex.org/findings/'
xpath = '//table'

tree = html.parse(url)
table = tree.xpath(xpath)[4]
raw_html = html.tostring(table)

df = pd.read_html(raw_html)[0]
df.head(10)
Add an iso3 column containing the 3-letter country codes. Map country names from the Global Slavery Web site that differ from those used in the GeoNames DB with the corresponding names beforehand. Then calculate the percentage of slaves relative to the total population for all countries in the dataset.
cnames = gc.get_countries_by_names()
mapping = {
    u"Côte d'Ivoire": 'Ivory Coast',
    'Republic of Congo': 'Democratic Republic of the Congo',
    'Timor-Leste': 'East Timor',
    'Hong Kong, SAR China': 'Hong Kong'
}

def get_iso3(name):
    if name in mapping:
        name = mapping[name]
    return cnames[name]['iso3']

df['iso3'] = df['Country Name'].apply(get_iso3)
df['Calculated Percentage of Enslaved'] = df['Calculated Number of Enslaved'] / df['Population'] * 100
The modified data frame now has 2 additional columns needed to create the interactive map with D3.
df.head(10)
Save the full data frame and one containing only the columns to display on the gobal slavery map as CSV files. Make sure to set the correct encoding.
df.to_csv('../static/data/csv/globalslaveryindex-full.csv', encoding='utf-8')
df[['iso3', 'Calculated Number of Enslaved', 'Calculated Percentage of Enslaved']].to_csv('../static/data/csv/globalslaveryindex.csv', encoding='utf-8')
Volcano Map Poster
Recommended Books

IPython Interactive Computing and Visualization Cookbook

Python for Data Analysis: Data Wrangling with Pandas, NumPy, and IPython

Python Data Visualization Cookbook
Links to Amazon and Zazzle are associate links, for more info see the disclosure.

About this post
This post was written by Ramiro Gómez (@yaph) and published on May 05, 2014.
blog comments powered by Disqus