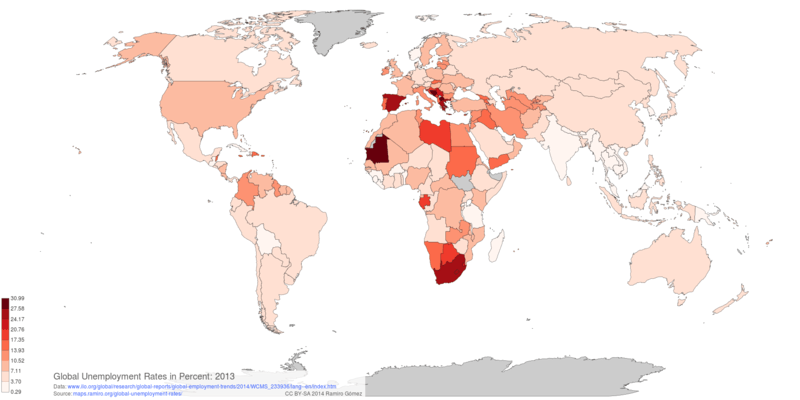
Global Unemployment Rates
Code to retrieve and cleanup data on global unemployment rates from the International Labor Organization.
import re
import requests
import geonamescache

import pandas as pd
import matplotlib.pyplot as plt

from collections import defaultdict
from datetime import datetime
from geonamescache import mappings

gc = geonamescache.GeonamesCache()
Get the HTML source of the page.
url ='http://www.ilo.org/global/research/global-reports/global-employment-trends/2014/WCMS_233936/lang--en/index.htm'
html = requests.get(url).text
Extract the data from the source using regular expressions and remove some characters.
re_data = re.compile(r'data\.addRows\(\[\s+(.*?)\s+\]\);', re.DOTALL)
re_sep = re.compile(r',\n')
re_rm = re.compile(r'[\[\]"]+')
re_data_entry = re.compile(r"'(.+?)','([^']+)',([^']+)")

matches = re.search(re_data, html)
data_text = re.sub(re_rm, '', matches.group(1))
data_list = re.split(re_sep, data_text)
Create dict from data list and turn that into a pandas DataFrame.
data_dict = defaultdict(dict)
for item in data_list:
    m = re.match(re_data_entry, item)
    if not m:
        print(item)
        continue
    country = m.group(1).replace('\\', '')
    year = int(m.group(2))
    val = float(m.group(3))
    data_dict[country][year] = data_dict[country].get(year, val)

df_data = pd.DataFrame.from_dict(data_dict, orient='index')
Add a Country and an iso3 column for rendering the map with d3.geomap, mapping country names from geonamescache, in the process fix some encoding issues in the retrieved source data.
cnames = gc.get_countries_by_names()

mappings.country_names["Côte d'Ivoire"] = 'Ivory Coast'
mappings.country_names["Réunion"] = 'Reunion'

def get_iso3(name):
    if name in mappings.country_names:
        name = mappings.country_names[name]
    return cnames[name]['iso3']

df_data['country'] = df_data.index
df_data['iso3'] = df_data['country'].apply(get_iso3)
del df_data['country']
Change column names to indicate the current and future years are projected.
current_year = datetime.now().year

def cols(name):
    if isinstance(name, int) and name >= current_year:
        name = '%d Projected' % name
    return str(name)

df_data.columns = df_data.columns.map(cols)
Save as CSV and print column names for setting in Logya content header.
df_data.to_csv('../static/data/csv/global-unemployment-rates.csv', encoding='utf-8', index=False)
'[%s]' % ', '.join(["'%s'" % col for col in df_data.columns if col != 'iso3'])
Volcano Map Poster
Recommended Books

IPython Interactive Computing and Visualization Cookbook

Python for Data Analysis: Data Wrangling with Pandas, NumPy, and IPython

Python Data Visualization Cookbook
Links to Amazon and Zazzle are associate links, for more info see the disclosure.
Map Preview

About this post
This post was written by Ramiro Gómez (@yaph) and published on July 22, 2014.
blog comments powered by Disqus