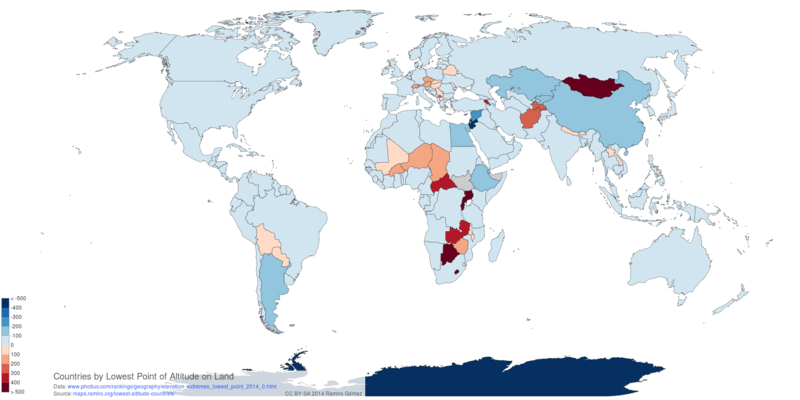
Countries by Lowest Point of Altitude on Land
IPython Notebook to retrieve, process, display and plot data on lowest point of altitude on land for 80 countries and Antarctica from photius.com, which compiled the data from the CIA World Fact Book 2014.
First import necessary libraries, setup geonames mapper, download data and turn it into a pandas DataFrame.
import pandas as pd
from lxml import html
from geonamescache.mappers import country

mapper = country(from_key='name', to_key='iso3')

url ='http://www.photius.com/rankings/geography/elevation_extremes_lowest_point_2014_0.html'
xpath = '//table'

tree = html.parse(url)
tables = tree.xpath(xpath)
raw_html = html.tostring(tables[4])
df = pd.read_html(raw_html, header=0)[0][['Country', 'Value']]
Process data
Add an iso3 column using the geonamescache mapper function created above, needed for rendering the d3 based map and set more meaningful column names.
df['iso3'] = df['Country'].apply(lambda x: mapper(x))
df.dropna(subset=['iso3', 'Value'], inplace=True)
df.set_index('Country', inplace=True)
df.columns = ['Altitude', 'iso3']
df.head()
Display and plot highest low points
First set some common plotting properties.
footer = 'CC BY-SA 2014 Ramiro Gómez - ramiro.org • Data: www.photius.com/rankings/geography/elevation_extremes_lowest_point_2014_0.html'
mpl.rcParams['font.size'] = 11
mpl.rcParams['font.family'] = 'Ubuntu'
mpl.rcParams['axes.color_cycle'] = 'a6cee3, 1f78b4, b2df8a, 33a02c, fb9a99, e31a1c, fdbf6f, ff7f00, cab2d6'
Show highest low points
df.sort('Altitude', inplace=True)
df.tail(10)
Plot highest low points
s = df['Altitude'][-10:]
s.plot(kind='barh', figsize=(10, 6), title='Countries by Highest Low Point of Altitude on Land\n', fontsize='large')

ax = plt.axes()
ax.spines['top'].set_visible(False)
ax.spines['right'].set_visible(False)
ax.spines['bottom'].set_visible(False)
ax.spines['left'].set_color((1, 1, 1))
ax.xaxis.set_label_text(footer)
ax.xaxis.set_ticklabels('')
ax.yaxis.set_label_text('')

for i, x in enumerate(s):
    ax.text(x + 10, i - .1, int(x), ha='left', fontsize='large')

plt.savefig('../static/img/graphs/highest-low-point-altitude-countries.png', bbox_inches='tight')

Show lowest low points
df.head(10)
Plot lowest low points
s = df['Altitude'][:10].apply(lambda x: x * -1)
s.plot(kind='barh', figsize=(10, 6), title='Countries by Lowest Low Point of Altitude on Land\n', fontsize='large')

ax = plt.axes()
ax.spines['top'].set_visible(False)
ax.spines['right'].set_visible(False)
ax.spines['bottom'].set_visible(False)
ax.spines['left'].set_color((1, 1, 1))
ax.xaxis.set_label_text(footer)
ax.xaxis.set_ticklabels('')
ax.yaxis.set_label_text('')

for i, x in enumerate(s):
    ax.text(x + 20, i - .1, int(-x), ha='left', fontsize='large')

plt.savefig('../static/img/graphs/lowest-low-point-altitude-countries.png', bbox_inches='tight')

df.to_csv('../static/data/csv/lowest-altitude-countries.csv', encoding='utf-8', index=False)
Volcano Map Poster
Recommended Books

IPython Interactive Computing and Visualization Cookbook

Python for Data Analysis: Data Wrangling with Pandas, NumPy, and IPython

Python Data Visualization Cookbook
Links to Amazon and Zazzle are associate links, for more info see the disclosure.
Map Preview

About this post
This post was written by Ramiro Gómez (@yaph) and published on October 21, 2014.
blog comments powered by Disqus