A notebook to retrieve and process data about the 50 most murderous cities in the world by homicide rate.
import io
import json
import os
import re

import pandas as pd
import requests

from geonamescache import GeonamesCache

re_num = re.compile(r'^[\d,.]+$')
gc = GeonamesCache()
cnames = gc.get_countries_by_names()
Get the data
Fetch the Wikipedia table from the page List of cities by murder rate as a CSV file.
url = 'http://wikitables.geeksta.net/dl/?url=https%3A%2F%2Fen.wikipedia.org%2Fwiki%2FList_of_cities_by_murder_rate&idx=0'
csv = requests.get(url).text
Clean and Process the data
Read the CSV into a pandas data frame and convert all numeric values to floats.
def fix_num(x):
    if (isinstance(x, str) and re.search(re_num, x)):
        return float(x.replace(',', ''))
    return x

df = pd.read_csv(io.StringIO(csv), index_col='Rank')
df = df.applymap(fix_num)
Set the 2-letter ISO country codes from the country names.
df['iso'] = df['Country'].apply(lambda x: cnames[x]['iso'])
df['iso3'] = df['Country'].apply(lambda x: cnames[x]['iso3'])
Retrieve geo coordinates for the 50 cities from GeonamesCache or the geonames Web service.
cities_by_geoid = gc.get_cities()
geonames_params = {
    'maxRows': 1,
    'username': os.environ['GEONAMES_USER']
}

def geonames_search(name, country):
    geonames_params['q'] = name
    geonames_params['country'] = country
    resp = requests.get('http://api.geonames.org/searchJSON', params=geonames_params)
    if resp.ok:
        content = json.loads(resp.text)
        return content

def get_geoid(cityname, iso):
    cities = gc.get_cities_by_name(cityname)
    if cities:
        # Pick the first city that matches the ISO code
        for city in cities:
            return list(city.keys())[0]
    else:
        content = geonames_search(cityname, iso)
        if content['geonames']:
            d = content['geonames'][0]
            geoid = d['geonameId']
            cities_by_geoid[geoid] = {
                'longitude': d['lng'],
                'latitude': d['lat']
            }
            return geoid
        else:
            print(content)

def get_city_prop(geoid, prop):
    if geoid in cities_by_geoid:
        return cities_by_geoid[geoid][prop]

df['city_geoid'] = df.apply(lambda x: get_geoid(x['Municipality'], x['iso']), axis=1)
df['longitude'] = df['city_geoid'].apply(lambda x: get_city_prop(x, 'longitude'))
df['latitude'] = df['city_geoid'].apply(lambda x: get_city_prop(x, 'latitude'))
Remove unused columns and improve column name.
df.drop(['iso', 'city_geoid'], axis=1, inplace=True)
df.columns = ['Municipality', 'Country', 'Homicides (2013)', 'Population (2013)', 'Homicides per 100,000 People', 'iso3', 'longitude', 'latitude']
df.head()
df.to_csv('../static/data/csv/most-murderous-cities.csv')
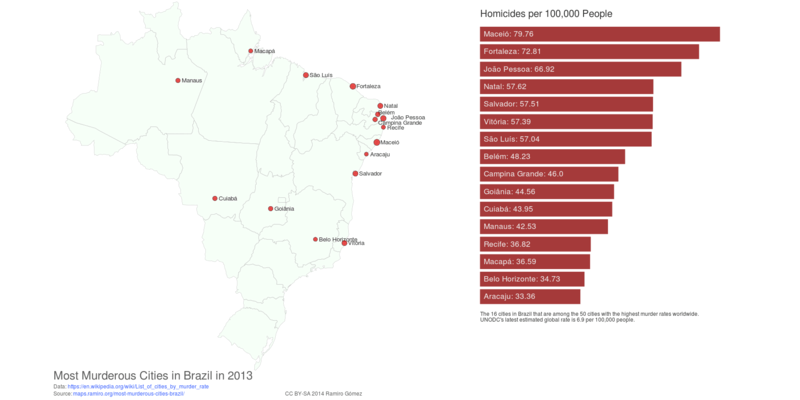
Limit to cities in Brazil.
df_bra = df[df['iso3'] == 'BRA']
df_bra.to_csv('../static/data/csv/most-murderous-cities-bra.csv')
Volcano Map Poster
Recommended Books

IPython Interactive Computing and Visualization Cookbook

Python for Data Analysis: Data Wrangling with Pandas, NumPy, and IPython

Python Data Visualization Cookbook
Links to Amazon and Zazzle are associate links, for more info see the disclosure.
Map Preview

About this post
This post was written by Ramiro Gómez (@yaph) and published on June 30, 2014.
blog comments powered by Disqus