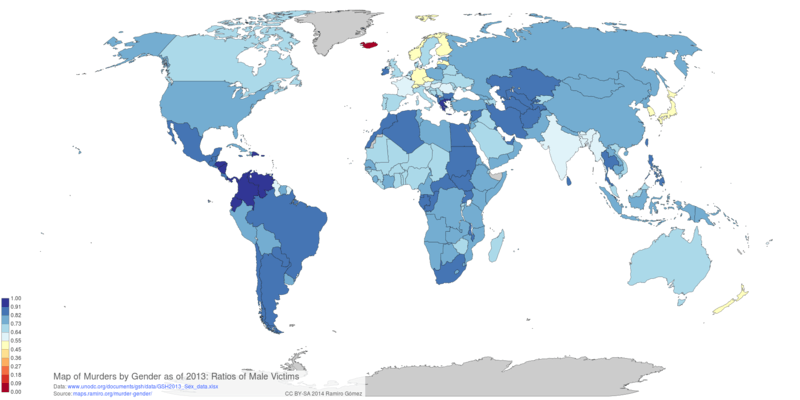
Murders by Gender
This notebook shows how to pre-process the Percentage of male and female homicide victims dataset from the United Nations Office on Drugs and Crime to create choropleth maps that show differences of gender ratios of murder victims across countries.
The data is in Excel format and will be read into a Pandas DataFrame to add the iso3 identifier for the countries, remove unused columns and save the DataFrame as a CSV to be loaded from JavaScript.
import pandas as pd
import geonamescache

from geonamescache import mappings

gc = geonamescache.GeonamesCache()
df = pd.read_excel('data/GSH2013_Sex_data.xlsx', 'sex', skiprows=5)
df.head()
Remove unused columns and rows with missing data.
del df['Region'], df['Sub-region'], df['Source'], df['Unnamed: 4'], df['Year']
df.dropna(axis=0, how='all', inplace=True)
Add a column with iso3 codes, map country name variants to the ones used in GeoNames.
cnames = gc.get_countries_by_names()

def get_iso3(name):
    # * means no homicide was recorded in the respective year
    name = name.replace('*', '').strip()
    if name in mappings.country_names:
        name = mappings.country_names[name]
    return cnames[name]['iso3']

df['iso3'] = df['Country/territory'].apply(get_iso3)
df.set_index('Country/territory', inplace=True)
Top 10 countries with the highest ratios of female murder victims
df[['Females']].sort('Females').tail(10).plot(kind='barh')
plt.show()

Top 10 countries with the highest ratios of male murder victims
df[['Males']].sort('Males').tail(10).plot(kind='barh')
plt.show()

Remove the Country/territory column, give the remaining columns a little more meaningful names and save the data frame as a CSV file using the correct encoding.
df.columns = ['Ratios of Male Victims', 'Ratios of Female Victims', 'iso3']
df.to_csv('../static/data/csv/murder-gender.csv', encoding='utf-8', index=False)
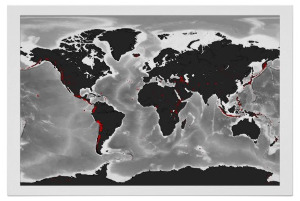
Volcano Map Poster
Recommended Books
IPython Interactive Computing and Visualization Cookbook
Python for Data Analysis: Data Wrangling with Pandas, NumPy, and IPython
Python Data Visualization Cookbook
Links to Amazon and Zazzle are associate links, for more info see the disclosure.

About this post
This post was written by Ramiro Gómez (@yaph) and published on June 02, 2014.
blog comments powered by Disqus