USA County Health Rankings
Create CSV files for choropleth maps of the USA displaying data from County Health Rankings.
In [1]:
import pandas as pd

# FIPS as string so leading zeros are kept
converters = {'FIPS': str}

df = pd.read_excel('data/2014 County Health Rankings Data - v1.xls', 'Ranked Measure Data', skiprows=1, converters=converters)
df.head()
Out[1]:
USA Alcohol-Impaired Driving Deaths
- # Alcohol-Impaired Driving Deaths: The total number of alcohol-impaired motor vehicle deaths
- # Driving Deaths: The total number of motor vehicle deaths
- % Alcohol-Impaired: Percent of driving deaths with alcohol involvement
Select relevant columns and drop NA values so columns can be converted to integers, see Support for integer NA.
In [2]:
df_out = df.copy()[['FIPS', '# Alcohol-Impaired Driving Deaths', '# Driving Deaths', '% Alcohol-Impaired']]
df_out.dropna(inplace=True)
df_out['# Alcohol-Impaired Driving Deaths'] = df_out['# Alcohol-Impaired Driving Deaths'].astype(int, copy=False)
df_out['# Driving Deaths'] = df_out['# Driving Deaths'].astype(int, copy=False)
Adapt column names to map title and write CSV file.
In [3]:
df_out.columns = ['FIPS', 'Total Number with Alcohol Involvement', 'Total Number', 'Percent with Alcohol Involvement']
df_out.to_csv('../static/data/csv/usa-alcohol-driving-deaths.csv', encoding='utf-8', index=False)
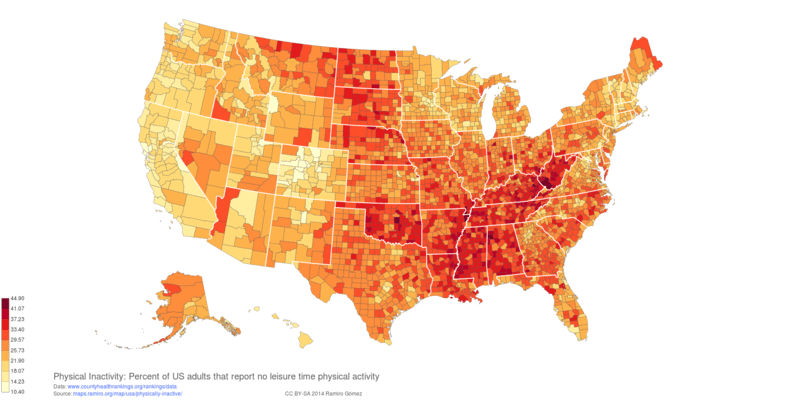
Physically Inactive
Percent of adults that report no leisure time physical activity.
In [4]:
df_out = df.copy()[['FIPS', '% Physically Inactive']]
df_out.dropna(inplace=True)
In [5]:
df_out.columns = ['FIPS', '% Physically Inactive']
df_out.to_csv('../static/data/csv/usa-physically-inactive.csv', encoding='utf-8', index=False)
Volcano Map Poster
Recommended Books

IPython Interactive Computing and Visualization Cookbook

Python for Data Analysis: Data Wrangling with Pandas, NumPy, and IPython

Python Data Visualization Cookbook
Links to Amazon and Zazzle are associate links, for more info see the disclosure.

About this post
This post was written by Ramiro Gómez (@yaph) and published on November 14, 2014.
blog comments powered by Disqus