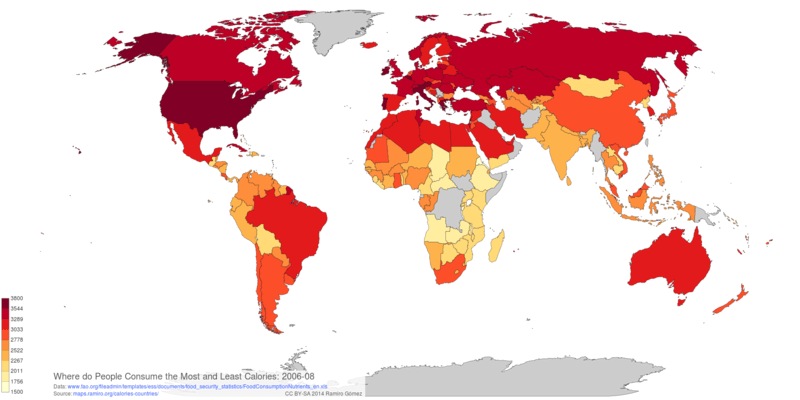
Dietary Energy Consumption
IPython Notebook to cleanup, display and plot data on calorie (kcal) consumption per person and day for over 174 countries. The data is contained in this XLS file provided by the FAO Statistics Division.
In [1]:
import pandas as pd

from geonamescache.mappers import country
country_name_to_iso3 = country(from_key='name', to_key='iso3')

info = 'Average dietary energy consumption per person per day in kilocalories.\n'
footer = 'CC BY-SA 2014 Ramiro Gómez - ramiro.org • Data: FAO Statistics Division - fao.org'
mpl.rcParams['font.size'] = 11
mpl.rcParams['font.family'] = 'Ubuntu'
mpl.rcParams['axes.color_cycle'] = 'a6cee3, 1f78b4, b2df8a, 33a02c, fb9a99, e31a1c, fdbf6f, ff7f00, cab2d6'

df = pd.read_excel('data/FoodConsumptionNutrients_en.xls', 'Dietary Energy Cons. Countries', skiprows=2).dropna()
del df['Country Code']
df.head()
Out[1]:
Prepare data
Create a new iso3 column based on country names using the geonamescache package as this is needed for rendering the interactive map.
In [2]:
df['iso3'] = df['Country name'].apply(country_name_to_iso3)
df.set_index('Country name', inplace=True)
In [3]:
df.sort('2006-08', inplace=True)
s = df['2006-08'].head(10)

s.plot(kind='barh', figsize=(10, 6), title='Least Calories Consumed per Capita per Day\n', fontsize='large')

ax = plt.axes()
ax.spines['top'].set_visible(False)
ax.spines['right'].set_visible(False)
ax.spines['bottom'].set_visible(False)
ax.spines['left'].set_color((1, 1, 1))
ax.xaxis.set_label_text(info + footer)
ax.xaxis.set_ticklabels('')
ax.yaxis.set_label_text('')

for i, x in enumerate(s):
    ax.text(x + 100, i - .1, int(x), ha='left', fontsize='large')

plt.savefig('../static/img/graphs/least-calories-countries.png', bbox_inches='tight')

In [4]:
s = df['2006-08'].tail(10)
s.plot(kind='barh', figsize=(10, 6), title='Most Calories Consumed per Capita per Day\n', fontsize='large')

ax = plt.axes()
ax.spines['top'].set_visible(False)
ax.spines['right'].set_visible(False)
ax.spines['bottom'].set_visible(False)
ax.spines['left'].set_color((1, 1, 1))
ax.xaxis.set_label_text(info + footer)
ax.xaxis.set_ticklabels('')
ax.yaxis.set_label_text('')

for i, x in enumerate(s):
    ax.text(x + 100, i - .1, int(x), ha='left', fontsize='large')

    plt.savefig('../static/img/graphs/most-calories-countries.png', bbox_inches='tight')

In [5]:
df.to_csv('../static/data/csv/calories-countries.csv', encoding='utf-8', index=False)
Volcano Map Poster
Recommended Books

IPython Interactive Computing and Visualization Cookbook

Python for Data Analysis: Data Wrangling with Pandas, NumPy, and IPython

Python Data Visualization Cookbook
Links to Amazon and Zazzle are associate links, for more info see the disclosure.

About this post
This post was written by Ramiro Gómez (@yaph) and published on October 14, 2014.
blog comments powered by Disqus