Drunks in the US
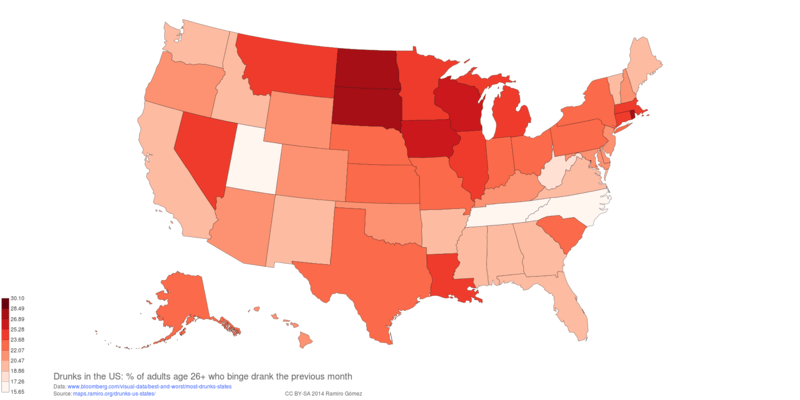
Notebook to retrieve and cleanup statistics on US adults age 26 and above who reported bing drinking in the previous month based on data collected from approximately 67,500 individuals in 2011 and 2012 by the Substance Abuse and Mental Health Services Administration and published by Bloomberg.
import pandas as pd
import matplotlib.pyplot as plt
import geonamescache

from lxml import html

gc = geonamescache.GeonamesCache()

url ='http://www.bloomberg.com/visual-data/best-and-worst/most-drunks-states'
xpath = '//*[@class="hid"]'

tree = html.parse(url)
table = tree.xpath(xpath)[0]
raw_html = html.tostring(table)

df = pd.read_html(raw_html, header=0, parse_dates=[1])[0]
df.head()
Cleanup columns by removing unnecessary characters and convert percentage value into float.
df['State'] = df['State'].apply(lambda x: x.rstrip('t').strip())
df['Binge drank in previous month'] = df['Binge drank in previous month'].apply(lambda x: float(x.rstrip('%')))
Map state names to FIPS codes and delete columns not needed in the Web based map.
states = gc.get_dataset_by_key(gc.get_us_states(), 'name')
df['fips'] = df['State'].apply(lambda x: 'US' + states[x]['fips'])

del df['Rank'], df['State']
df.head(5)
Use more meaningful column heading and save as CSV.
df.columns = ['% of adults age 26+ who binge drank in previous month', 'fips']
df.to_csv('../static/data/csv/drunks-us-states.csv', encoding='utf-8', index=False)
Volcano Map Poster
Recommended Books

IPython Interactive Computing and Visualization Cookbook

Python for Data Analysis: Data Wrangling with Pandas, NumPy, and IPython

Python Data Visualization Cookbook
Links to Amazon and Zazzle are associate links, for more info see the disclosure.

About this post
This post was written by Ramiro Gómez (@yaph) and published on August 03, 2014.
blog comments powered by Disqus