Loading...
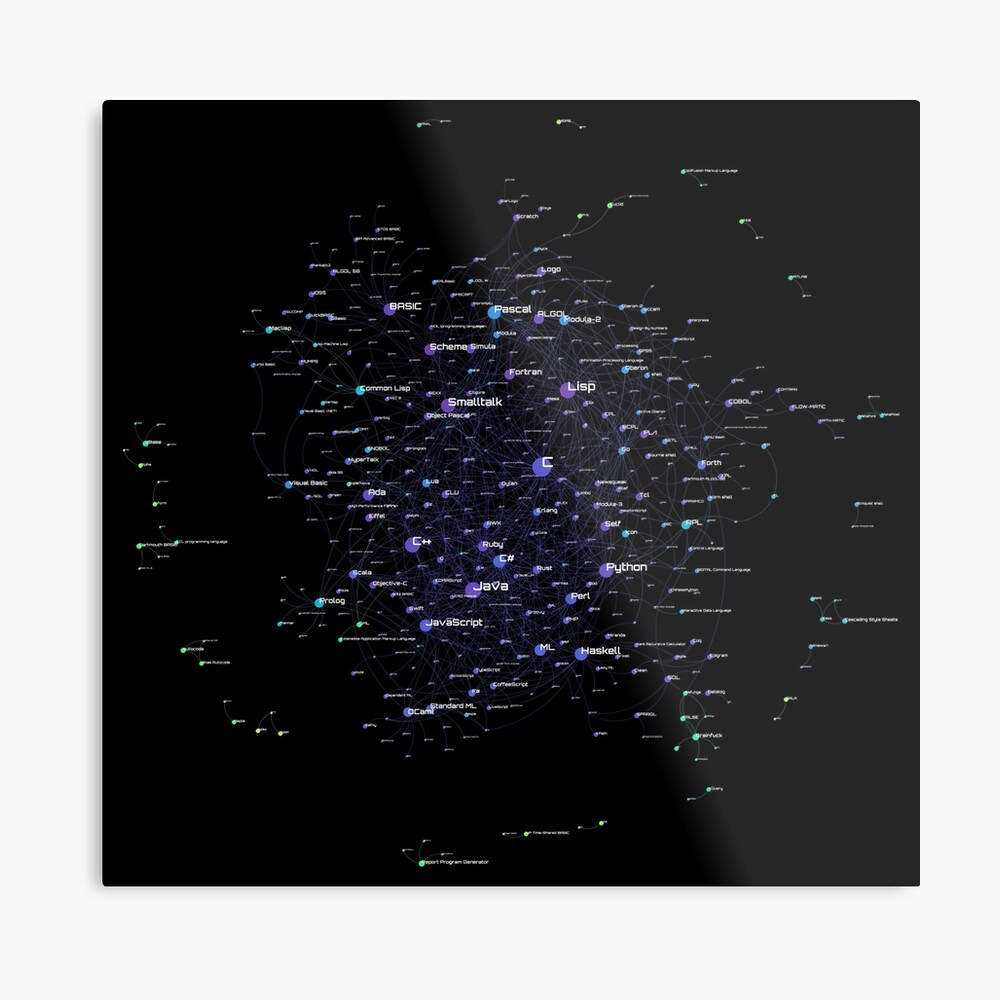
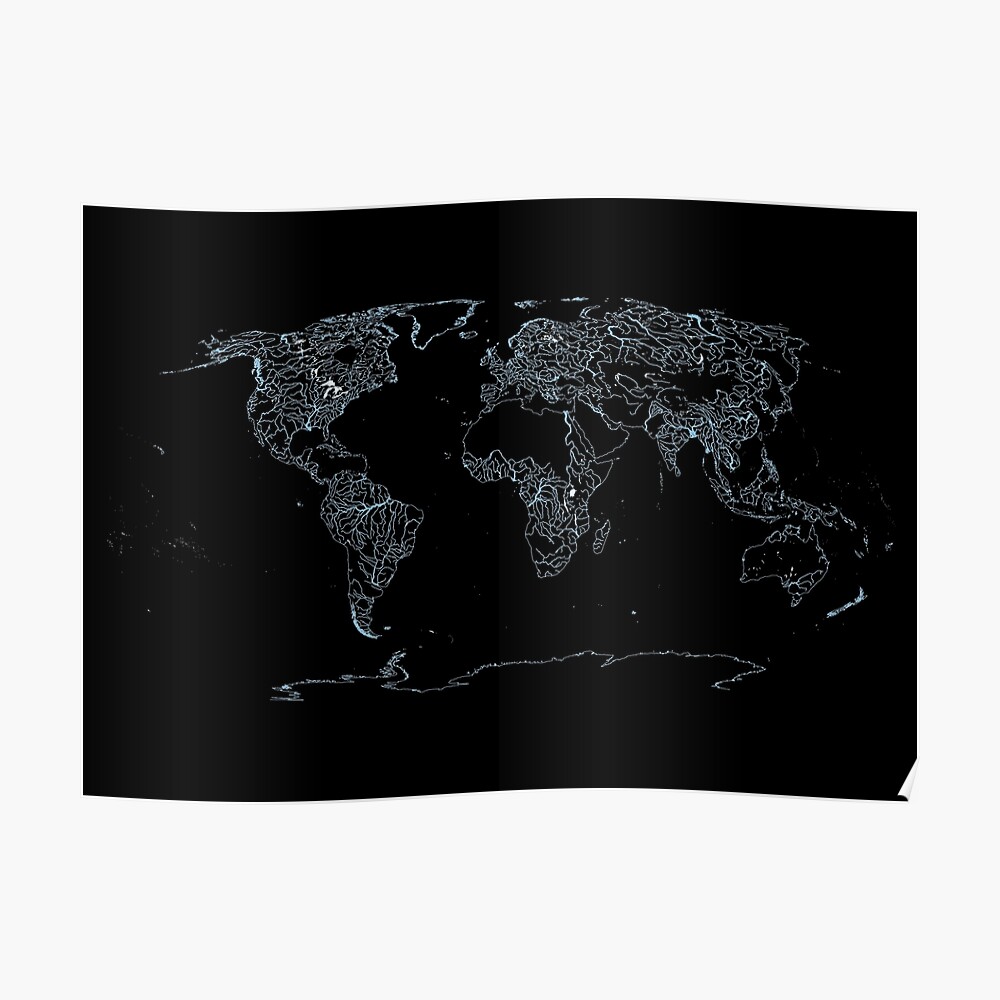
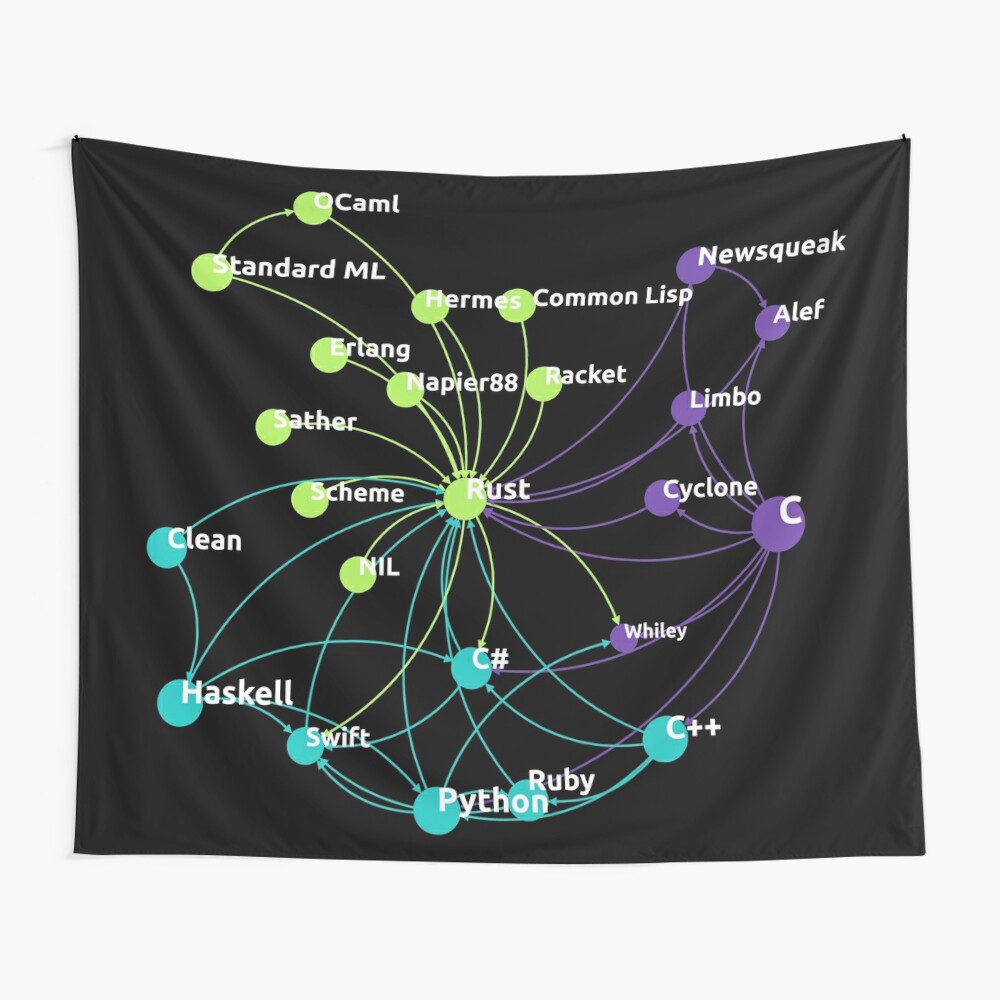
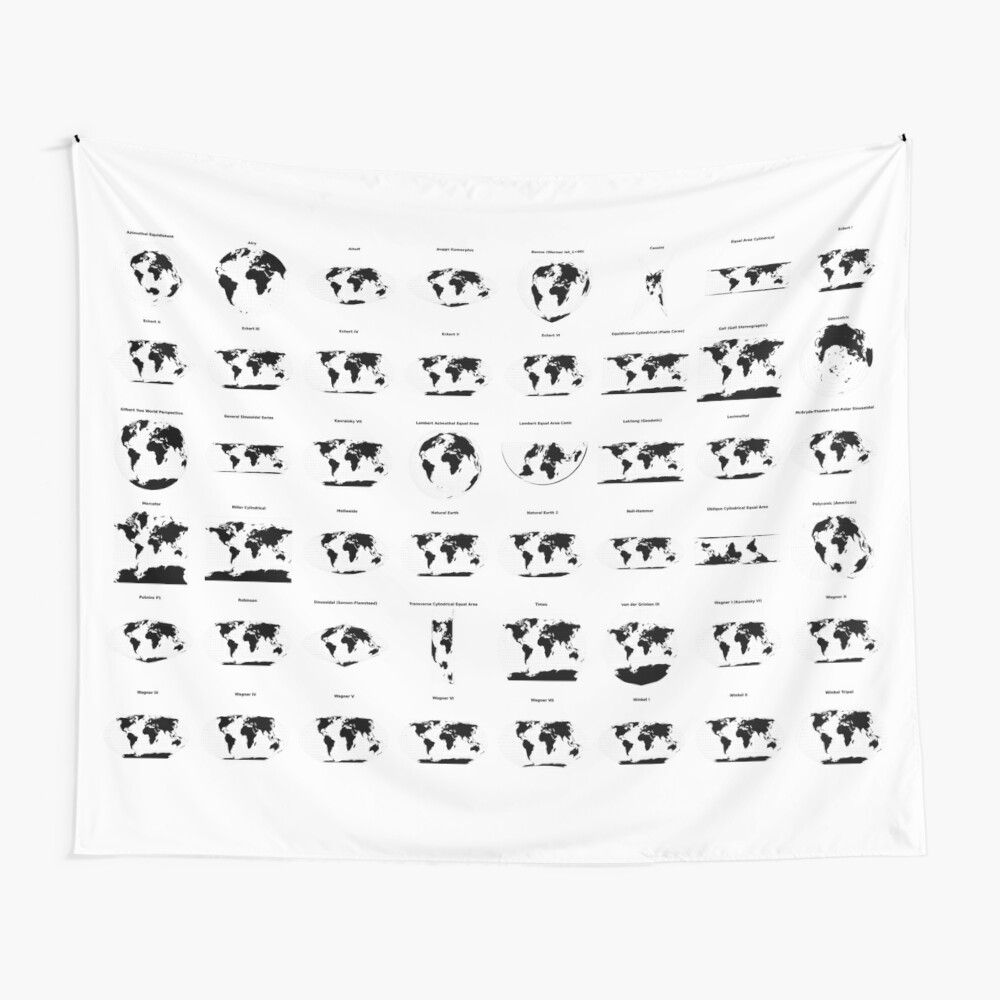
Graph and map prints on posters and other products
This map of the world displays recent earthquakes as yellow to red circles. The circle sizes correspond to the magnitudes of the earthquakes taking into account that the Richter magnitude scale is a logarithmic scale, where an earthquake that measures 5.0 has a shaking amplitude 10 times larger than one that measures 4.0.
Earthquake data is retrieved via real-time feeds from the U.S. Geological Survey (USGS). By default data is loaded once. When Auto-update data in the top menu is checked, data will be refreshed every minute. Moreover, you can choose different time and earthquake magnitude ranges from the select list in the top menu.
You can zoom in by clicking on the area of a country and zoom out by clicking outside of a country. When you move the mouse over an earthquake circle a tooltip with magnitude and location information is displayed, when you click on a circle you are sent to the earthquake's corresponding detail page on the USGS website.
Published: June 04, 2016 by Ramiro Gómez.
If you want to be notified about new content, click here to subscribe to the newsletter or RSS feed.
Disclosure: External links on this page may contain affiliate IDs, which means that I earn a commission if you make a purchase via such a link. This allows me to operate this site and offer hopefully valuable content that is freely accessible. More information about affiliate programs.